3. Event structure and generic handlers
This chapter introduces basics of the event data handling needed to deal with generic handlers. Generic handlers are powerful and versatile, but they demand user to know the structure (data model) of the event.
As in previous chapter, we will operate at the very basic level of DAQ digits to avoid complex pipelines and hidden parameters.
3.1. Event and hits collections
An event in the NA64sw is defined internally as a data structure. It is not flat, meaning that it can not be represented entirely as a single table or ntuple as it has rather complex topology.
The event object consists of collections of smaller, simpler objects. Those simpler objects then may, in order, be represented as table.
It is pretty much like a bunch of interconnected C/C++
structures or a set of TTree instances, or a filesystem subtree (files and
directories) or normal form in relational DB, etc. – that’s a pretty
common pattern in programming to structure hierarchical data.
Examples of collections within an event:
(M)SADC-based detector hits (ECAL, HCAL, SRD, beam counters, etc)
APV-based detector hits (MicroMegas, GEMs)
Clusters on APV detectors
Track points, built of APV clusters or MSADC hits
Tracks
For details on how the event data is structured, consider reading the Event object model paragraph of our concepts documentation.
For instance, basic hits raw data (like RawDataSADC
and RawDataAPV) are just plain C structures built
with scalar values defined.
Note
NA64sw benefits from C++ strong typing and event’s data topology is defined at compile time. So, there is no handlers that can create new types of collections within an event. Only creation/deletion of the elements within defined collections can be performed by handlers.
From a user point of view, the most interesting are the scalar values defined in these complex structures. They refer to particular physical quantities.
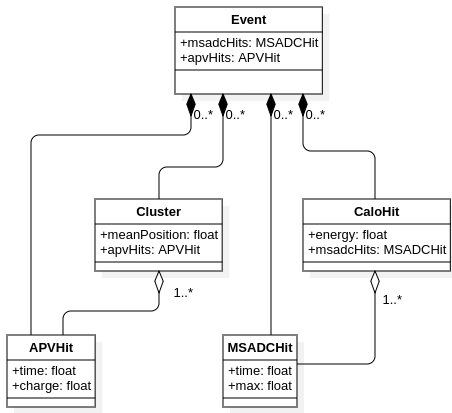
Illustrative example of Event class diagram with aggreagations. For
details on graphic notation, see Event object model.
At a very basic level, an every handler deals with one event at a time. Of course, within an event a handler may iterate over a collection of hits to apply a certain operation or complex algorithm to every object in this collection (hit, cluster, track point, track, etc).
3.2. Generic handlers: a foreword
Besides of specific handlers designed for specific purpose (like subtracting pedestals), NA64sw provides some generic tools to access this data: to plot, to modify or to remove hits from event or to exclude an event from further processing (i.e. apply a cut).
From C/C++ point of view, by using generic handlers one can avoid the need to implement a new handler each time one need to plot (or, say, cut) a new quatnity within an event or a hit. It may not seem so crucial for this basic tutorial, but if you are familiar with C++ programming you probably would appreciate an effort.
One of this common and simplest operations is to accumulate a certain value as 1D histogram. To be more specific, consider example from previous chapter: we’ve calculated a sum of waveform and used a handler parameterised with name of the value:
- _type: Histogram1D
  value: sadcHits.rawData.sum
  histName: "sum"
  histDescr: "Amplitude sum, {TBName} ; time, ns ; Events"
  nBins: 100
  range: [0, 5000]
We created a generic handler instance with a specific purpose to plot a
1D histogram for every SADC hit. The handler type (class) specified
as _type parameter was
Histogram1D. Parameters histName, histDescr, nBins, and
range are naturally expected for 1D histogram. But
value refers to a certain value within a hit and the question that one
immediately asks is how to know which data can be retrieved as value –
what else can we plot?
There are a number of ways to know:
One way is the handlers list provided here, in documentation: see Standard Handlers Library page – handlers are divided by their subject: MSADC hits, APV hits, clusters, tracking, etc. On the top of every page, all the attributes of corresponding data type are listed (in “Structure” paragraph).
Another way is to refer to the event structure diagram. This diagram is pretty bulky but comprehensive one.
Last, once one get familiar with C/C++ API of NA64sw one can consider looking directly into the code of
na64eventlibrary’s headers. Event and all its collections are merely a C++ structures with accessing functions defined in static arrays.
Let’s consider a practical example of building 2D correlation plot between maximum sample amplitude of (M)SADC waveform and its sum. These values have a practical meaning with respect to physical data reconstruction as they are both proportional to the energy deposition in calorimeter cells.
If you have followed previous chapter, you may try to do this task by your own while section below describes foreseen steps to do it.
3.3. Excercise: building a pipeline
The
sumvalue is already calculated by ourcustom.yamlconfig from previous chapter. If you’ve lost this file, you may copy a pre-defined one:$ cp $NA64SW_PREFIX/share/na64sw/run/tutorial/03-generics.yaml custom.yamlTo get the maximum value defined:
Find the maxima-finding handlers for SADC by
grep’ing thena64sw-pipe -loutput:$ na64sw-pipe -l | grep maxWe see a number of matching results. Well, finding maximum sample in SADC waveform is a bit sensitive task, so there are few algorithms, but for this tutorial’s purposes let’s limit ourselves with simplest possible variant:
SADCFindMaxSimple. According to the description this handler need no settings except for optionalapplyTothat we will discuss a bit later. Since it is optional it is safe to omit it so far.Append
custom.yamlwith- _type: SADCFindMaxSimple
to get
maxSampleandmaxValueofRawDataSADCset (as it is promised in the handler’s doc).
To build the plot iself:
For this task we will need a 2D histogram plotter that operates within a single instance of
SADCHit. A generic handler for that isHistogram2Dand we can parameterize it with max/sum values.On the generic handlers page we see the usage example for handler
Histogram2D. It is pretty similar to its 1D counterpart – the main difference is that parameter names now haveXandYsuffixes.Let’s say we want to get the sum value calculated on previous step. Description of the
SADCDirectSum/SADCLinearSumrefer to asumattribute ofRawDataSADCmember ofSADCHit. The documentation says it can be accessed viarawData.sumpath.Limits for histogram may be tuned only empirically, since wefor raw (uncalibrated) values there are very few preliminary expectations
This way, the block we need to visualize max/sum correlation is:
- _type: Histogram2D
  valueX: sadcHits.rawData.sum
  valueY: sadcHits.rawData.maxAmp
  histName: "sumVsMax"
  histDescr: "MSADC sum vs max correlation, {TBName} ; sum ; max"
  nBinsX: 100
  rangeX: [0, 25000]
  nBinsY: 100
  rangeY: [0, 5000]
Running pipeline app with this configuration shall produce this kind of plot
built for every (M)SADC detector in .root output file.
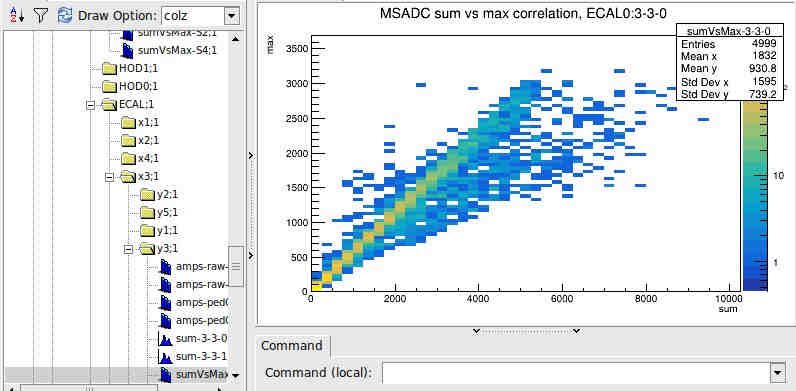
This strong correlation observed for most of the detectors of that type nicely demonstrates the fact that integrated charge and maximum signal value shall be in a strong agreement within a PMT pulse shape.